Warning: The text reproduced here is a copy of information published elsewhere. This information has either:
- been published freely on the internet and has been cached here as a precaution against future loss of servers and links, or
- been published historically and very few copies of the original text are still available for research purposes.
It is recommended that you look at the original source given below first, and use this text only if that source is not available to you. It is not intended that any text cached here infringe the copyright of the original author. If any copyright owner wishes their text removed from this site, this can be done by contacting the author.
Document summary:
- Title: Capsule Pipeline Transport Using An Electromagnetic Drive
- Author: Bruce Montgomery, Stephen Fairfax, Bradford Smith
- Source: http://www.magplane.com/html/pdf/pipline.pdf
- Copyright: Magplane
- Date: 2001
Capsule Pipeline Transport Using An Electromagnetic Drive
Bruce Montgomery, Magplane Technology, Inc,
380 Hanscom Drive, Bedford, MA 01730 [1]
and
Stephen Fairfax, MTechnology, Inc,
2 Central Street, Saxonville, MA 01701
and
Bradford Smith, Massachusetts Institute of Technology,
MIT NW 22, Cambridge, MA 02139
Abstract
Electromagnetic Drives for pipeline systems are intended as a direct replacement for pneumatic
drives. Pneumatic capsule pipelines have a long history, including the transport of limestone in a
Japanese cement processing plant. However, various practical limits tend to constrain the
throughput of pneumatic systems. The use of electromagnetic drives can greatly improve on the
constraints and can result in cost effective systems able to compete with truck, rail and other
transport systems. Underground pipe transport can also relieve the environmental impact of
conventional transport, and result in faster delivery in overcrowded metropolitan regions.
Development of our electromagnetic capsule pipeline system was initiated by the desire of the
Florida Phosphate Industry to find a cost effective way to reduce the environmental impact of
conventional transportation of their very large quantities of material [2]. Typical ore applications
would use an underground pair of 610 mm diameter pipes for outbound and returning capsules, and
would typically carry 10 millions tons per year over a distance of 2 to 50 km. Preliminary economic
studies have shown a satisfactory return on capital and have resulted in a willingness of the
phosphate industry to undertake a significant R&D program.
A demonstration project which uses a linear synchronous motor to move capsules has been
constructed at IMC-Global, a phosphate mining company in Lakeland, FL. The demonstration
project utilizes 275 m of 610 mm diameter centrifugal cast fiberglass pipe, and contains a 60 m long
accelerator/decelerator section, a switch, and load and unload stations. The test vehicle traverses
back and forth, obtaining a peak speed of 18 m/s. The 2.4 m wheelbase vehicle uses six-wheel
assemblies at each end of a rotating hopper, and has a payload capacity of 270 kg.
The paper reports on the performance of the system during the test program carried out to date in
which the basic feasibility of the design has been demonstrated. Plans are described for the followon
test program intended to provide an indication of component lifetimes.
Results from an economic model are presented and show the potential for an attractive return on
investment for future applications in the phosphate and other ore transport industries.
1.0 Introduction
A pneumatically driven capsule pipeline system has been in commercial use in Japan since 1983
[3]. It is used to transport limestone at a rate of 2 million metric tons per year between the
Karasawa mine and the Sumitomo Cement plant, a distance of 3200 meters. Prior to construction,
transport had been by rail. The parameters of the pipeline system are given in Table 1.0. An initial
economic analysis compared the capital cost of a largely above ground belt conveyor whose length
needed to be 4200 meters, with the largely underground 3200 meter capsule pipeline, and found
that the pipeline was slightly less costly. The pipeline was also felt to provide safety, noise and
right-of-way advantages.
A limestone quarry conveyor system of approximately the same length and twice the capacity of
the Sumitomo system is to be installed by Essroc Cement Group in Nazarith, PA. It will be 2.7 km
in length, and have a throughput of 730 metric tons per hour.
| Variable | Value |
|---|---|
| Material transported | Limestone |
| Pipe Diameter | 1.0 meter |
| Transport Distance | 3200 meters |
| Annual Throughput Capacity | 2 million metric tons |
| Throughput capacity | 346 metric tons/hr |
| Capsules per train | 3 |
| Payload per train | 4,800 kg |
| Launch Interval | 50 seconds |
| Average velocity | 9 m/s |
| Pipeline Fill-Factor | 2.7 percent |
In a recent economic analysis of freight pipeline transport, Henry Liu points out that pneumatic
pipelines have not found a large market because in most cases they can not compete with trucks
on economic grounds [4]. He points out that pneumatic pipelines are limited to a rather small linefill
because of the limitations on the blowers. The Sumitomo system in Table 1 has a fill factor of 2.7
%. A relatively large pipeline is therefore required for the throughput capacity achieved. He points
out the throughput is further limited by the conventional use of inline loading and unloading. Liu
concludes that substituting an electromagnetic drive for the external blowers can achieve as much
as four times larger linefills, resulting in factors of two reductions in capital cost. William
Vandersteel had also pointed out the fundamental gains of switching to electromagnetic drives, and
has a basic early patent on the idea [5].
Both Liu and Vandersteel suggested the use of Linear Induction Motors (LIM) for the
electromagnetic drives. We have utilized Linear Synchronous Motors (LSM) for the drive because
they are tolerant of larger operating gaps. We believe this is a feature important to the construction
of realistic pipeline systems.
We can achieve velocities of 18 m/s, twice as high as those in table 1.0, further increasing capacity
for a given pipeline diameter. In our work we have also utilized electromagnetic switching, allowing
multiple off-line stations accessed by “no-moving parts” switches.
In our economic studies we find that electromagnetic drive systems can effectively compete with
truck and rail transport, and in selected cases, with slurry pipelines and conveyor systems.
2.0 Prototype System Description
To demonstrate the feasibility of elecromagnetic propulsion of capsules in pipeline applications, a
demonstration project has been constructed at IMC-Global, a phosphate mining company in
Lakeland, FL. [6,7]. The demonstration project utilizes 275 m of 610 mm diameter centrifugal cast
fiberglass pipe, and contains a 60 m long accelerator/decelerator linear synchronous motor section,
a switch, and load and unload stations. The test vehicle traverses back and forth, obtaining a peak
speed of 18 m/s. The 2.4 m wheelbase vehicle uses six-wheel assemblies at each end of a rotating
hopper, and has a payload capacity of 270 kg.
A cross section of the pipe containing a typical vehicle is shown in Figure 1, and the vehicle is
shown separately in Figure 2. The linear synchronous motor “stator” winding is mounted on the
outside of the tube leaving the inside of the tube free of obstructions. The permanent magnet
assembly mounted on the vehicle consists of four poles, alternately north and south.


2.1 Pipe:
A cast fiberglass “waste water” pipe product is used for the straight sections, and is supplied in 6 m
lengths with a 15 mm wall. Because the winding is on the exterior of the tube, the tube must be
made from a non-conducting material. The curved sections are fabricated from filament wound
fiberglass.
2.2 Vehicle:
The vehicle consists of a cylindrical open-top hopper 500 mm in diameter by 1200 mm long,
attached to wheel carriers at each end through pivot bearings. This allows the hopper and the wheel
assemblies to rotate independently around the pipeline central axis. Each wheel carrier has six
wheels spaced at equal 60 degree angles. The wheels are 150 mm diameter polyurethane coated
standard industrial units with sealed ball-bearings. A rolling friction coefficient of 0.01 is assumed.
The overall length of the vehicle is 2.4 m. The magnet assembly occupies a 90 degree by 1200 mm
long sector at the bottom of the vehicle, and in the version of the vehicle shown, has the ability to
rotate around the central axis independently from the hopper. The vehicle is pictured in Figure 3.

2.3 Magnet Assembly:
The magnet assembly consists of an array of individual blocks 50 mm x 50 mm x 12.7 mm deep,
magnetized parallel to the 12.7 mm dimension. They are located on a curved back-iron plate 610
mm by 1200 mm long by 12.7 mm thick. The 112 individual magnet blocks are arranged in sets of
28 to form four poles, two north and two south. The poles have a “pole pitch” of 305 mm, and a
repeat pitch of 610 mm. The magnets blocks are magnetized prior to mounting on the back iron.
The magnet assembly is pictured in Figure 4.

2.4 Linear Synchronous Motor Winding:
A linear synchronous motor concept was chosen over a linear induction motor concept because it
retains reasonable efficiency at large operating gaps. The gap between the magnet face and the
effective centerline of the winding is 32 mm. It is impractical to build pipeline systems with
tolerances tight enough to operate with gaps substantially less than this value.
The linear motor windings are wound in single modules attached to the outside of individual 6 m pipe
sections. The motor winding was designed to use a continuous length of electric wire rated for
direct burial. While this choice complicated the winding process, it resulted in the complete
elimination of internal connections between motor conductors. Only the six ends of the three-phase
windings need to be connected to the motor drive system. A laminated iron 12.5 mm thick backing
is included outside the winding to double the effective permanent magnet field at the winding,
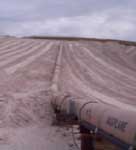
reducing the power requirement by a factor of four. An overview of the end of the accelerator section
prior to the hill climb is pictured in Figure 5, and a closeup of the winding end turns and back iron
mounted on the tube, in Figure 6.

In a freight transport pipeline there is no need for the capsules to maintain a constant velocity, and
therefore no need to cover the entire length of the line with motor windings. Rather the capsules can
coast between periodically spaced motor modules which boost the speed lost to wheel friction and
moving air in the pipe.
The fraction of motor coverage required is a function of the allowed loss of speed between motors,
the capability of the motors, the pipeline and capsule characteristics and the velocity and spacing
between capsules. For the prototype 610 mm pipeline and 545 kg loaded capsule, the minimum
percent coverage required on flat ground is 5% if vehicles are traveling at 1 second intervals and are
permitted to lose 10% of their 17.9 m/s speed before re-acceleration.
While limiting motor coverage to small percentages of the total pipeline has a beneficial economic
effect, it presents a potential problem of system restart after a loss of power. In the above examples
(assuming level ground) the 1 second spaced capsules would coast to a stop in 158 seconds,
traveling a distance of 1700 m. The relatively long coast times allow normal recovery from the most
common power failures which are only a few seconds in duration. The capsules would simply coast
to a somewhat lower velocity before being automatically re-accelerated when the power was
restored. However for long term power outages, a restart strategy is required.
The restart strategy chosen would depend on an assessment of the expected frequency of long
duration power outages. If it were once a year, a slow recovery could be tolerated; for example,
motorized “recovery” capsules could clear the pipeline. If the expectation were for much more
frequent long term outages, a more pro-active system would be required. The use of low cost,
“recovery” windings between fully powered motor section is a reasonable option.
The above discussion is based on a hypothetical level-ground installation. In cases where significant
altitude changes must be accommodated, motor coverage would need to be further increased.
2.5 Magnetic Switch
In the current design concept, the external switch coils interact with simple iron pieces on the
hopper side wall rather than with the swinging permanent magnets. A set of electromagnets
external to the pipe is used to magnetize and attract the iron added to the hopper. In this concept,
the external magnets are located at the 90 degree orientation along the length of the switch branch
but importantly, do not need to be synchronously driven. A DC current is applied to the magnets on
the side of the switch branch to be followed.
The four external switch magnets are each 2.4 m long, and are used to hold the car against the
inside wall of the 60 meter radius curved branch of the switch. A static test has been performed
using the external magnets and the re-built car to demonstrate that the magnets exert sufficient
force on the fully loaded car to hold it against the inner wall at full velocity.
The switch magnets are installed on the 9 m long horizontal curve of the pipeline. Sensors are used
to confirm that the car rides on the inside wall of the tube. When the switch magnets are not
energized, the vehicle will naturally follow the outside wall. Testing in a curved tube (as opposed to a
real “Y section” switch) is a necessary initial step, and demonstrates the critical element of the
switch at minimum expense.
2.6 Load and Unload Stations:
In the demonstration project the load station consists of an accumulation hopper with a control slide
valve which dumps through a chute into the at-rest hopper section. The unload station has the
ability to rotate the hopper 180 degrees, and leave a clear path through an opening in the pipe for
the load to gravity dump into a collection hopper. A transfer conveyor then returns the dumped load
back to the accumulation hopper. The load/unload stations are pictured in Figure 7.

It had been our original intent to demonstrate the feasibility of on-the-fly load and unload operations.
However, after studying other installations (for example, the Sumitomo pneumatic pipe line
installations) we determined that loading on-the-fly was not practical at the vehicle velocities that we
needed. We did, however, develop a conceptual design for un-loading on-the-fly, and did install the
magnetic systems necessary to demonstrate the essential features of the manipulation. That was
done by mechanically rotating the external magnets around the stationary car to dump the load
without mechanical contact. In an actual on-the-fly unloading station, a helical magnetic path would
have been constructed along the vehicle path. The stationary vehicle approach allowed the unload
and load stations to be integrated and the use of a short transfer conveyor to return the dumped
load to the loading hopper.
Economic analysis has confirmed that unloading on the fly is desirable but not essential. Depending
on system length, reduction in capital investment range from 5 % to 15% if on-the-fly unloading is
introduced.
2.7 Power Conversion and Control:
A standard 100 HP commercial four-quadrant variable speed motor drive is used to drive the
synchronous motor modules. The drives are outfitted with proprietary control systems to enable
them to automatically synchronize the LSM, and to interface with the global control system. An
output frequency of 30 Hz is synchronous with 18 m/s. Ten modules in series are required to
accelerate a fully loaded vehicle to 18 m/s. Five 100 HP drives, pictured in Figure 8 are time-shared
between the ten motor sections.
FIGURE 8: Five 100 HP motor control units shared between ten motors (not cached).
The drive system uses current-source inverter drives. Current-source inverters utilize SCRs, which
provide performance benefits in pulsed duty applications.
The motor, motor drive, and control systems must operate in a harsh mine environment with high
reliability and minimal maintenance. This requirement led us to reject solutions that required power
sources on each vehicle to transmit position and thrust angle information to the motor control
system. The motor control system therefore uses open-loop control of the linear synchronous motor
(LSM) thrust angle rather than feedback control.
The thrust that can be provided by the modules at a given speed is related to the phase angle
between the winding drive and the magnet poles on the capsule; it is maximum when the angle is
90 degrees. If feedback control between the vehicle position and the drive phase is employed,
angles approaching 90 degrees can be utilized. If the angle is reduced to 60 degrees, the system
will operate stably without feedback control. The thrust at 60 degrees drops to 87 % of the
maximum available, but is a reasonable tradeoff against the complexity of a feedback loop requiring
continuous and accurate position sensing, and the need for on-board transducers.
The calculated performance of a pair of boost modules sufficient to restore a 10 % drop in velocity is
given below, and is based on the prototype design. A commercial 100 HP conventional synchronous
motor drive unit is sufficient to power a module. The performance of the two motors can be seen to
be somewhat different, reflecting the speed dependent characteristics. The efficiency increases with
speed, but the increased back EMF developed by the vehicle motion cuts into the maximum voltage
limit on the drive, decreasing the current and thrust available.
| Variable | Value | Variable | Value |
|---|---|---|---|
| Velocity in (m/s) | 15.9 | Efficiency (%) | 55 |
| Velocity out (m/s) | 17 | Power factor(%) | 44 |
| Time (s) | 0.26 | Traction power (kW) | 37 |
| Acceleration (m/s^2) | 4.5 | Input power (kW) | 69 |
| Thrust (N) | 2242 | Input power (HP) | 93 |
| Variable | Value | Variable | Value |
|---|---|---|---|
| Velocity in (m/s) | 17 | Efficiency (%) | 58 |
| Velocity out (m/s) | 18 | Power factor(%) | 44 |
| Time (s) | 0.24 | Traction power (kW) | 37 |
| Acceleration (m/s^2) | 4.2 | Input power (kW) | 65 |
| Thrust (N) | 2090 | Input power (HP) | 88 |
The control system functions are divided between the Current Source Inverter (CSI) control card and
the Programmable Logic Controller (PLC) that coordinates the operation of individual motor drives,
load and unload stations, and the magnetic switch. The CSI control card is responsible for sensing
the position and speed of the car, synchronizing the magnetic field produced by the motor winding
to the vehicle, and determining appropriate acceleration or deceleration forces as a function of
vehicle velocity. The PLC enables each motor drive, sets target velocity and direction for each
motor drive, operates the load, unload, and switch mechanisms, and collects data from various
diagnostic instruments used for development. A personal computer provides development tools and
a graphical user interface for the operator.
3.0 Field Testing
3.1 Stage 1: Demonstration of Basic System Feasibility
The demonstration project was constructed to test the feasibility of the system concept and the
various components. Two hundred seventy five meters of 610 mm diameter pipeline were used. The
test allows the vehicle to be loaded and accelerated to 18 m/s, coast to a stop in climbing a 24 m
elevation hill; re-accelerate to 18 m/s in descending the hill, and decelerate to zero, unload, and
then recycled through the process. The switch demonstration is located between the accelerator
and the hill.
During six weeks of final testing 5300 round trip cycles of the car were run at speeds between 9 and
15 m/s. The total distance traveled by the car was approximately 700 miles, and the total travel time
about 40 hours.
A total of thirty-five complete load/unload cycles were run with a payload of 200 kg. The last twentyfive
cycles were run under total automatic PLC control.
The car was captured and dumped from the unload station carrying a maximum payload of 300 kg,
thus also demonstrating the ability of the magnetic coils to capture, rotate and dump a payload
30% higher than the nominal 500 pound payload. Prior to dumping, the loaded car was cycled 50
times at 11 m/s with the maximum payload.
The hopper fills and dumps cleanly. There is a minor problem in the loading station chute where
some rock is trapped by internal support structure. The trapped material has a tendency to vibrate
loose and fall into the bottom of the pipe after the car leaves the loading station. This minor spillage
was dealt with by cutting discharge holes in the bottom of the pipe; on the next cycle the car
sweeps the spillage out the holes.
The initial phasing of the ten motors have been tuned to achieve design levels of acceleration in the
individual motors. This phasing was made easier by the acceleration diagnostics. Sensors installed
at the exit of each motor are connected into the PLC. The PLC screen then presents the car
velocity at the exit of each motor and the calculated acceleration achieved by that motor.
Pressure measurements were made in the pipe ahead of the car. There had been some concern
that the relatively tight fit of the wheel plates in the pipe was producing excess aerodynamic drag. A
pressure pulse of 1.3 x 10^-3 atm (0.2 psi) appears when the 11m/s vehicle first closes off the
opening in motor 3 and compresses the air in the rest of the pipe. After the air column has fully
accelerated, however, the pressure drops below 25 % of that value, where the aerodynamic drag is
about 10 kg and thus unlikely to be a significant contributor to retarding acceleration at 11 m/s.
The maximum velocity achieved during the final testing was 15 m/s, 83 % of the design goals of
17.9 m/s. The maximum speed achieved is currently being limited by the voltage protection circuits
on the motor drives which are tripping out at only 60 % of the voltage capacity of the motor drives.
When proper high-power filter capacitors are installed on the motor drives, the car should be
capable of acceleration beyond the current velocity limit.
With the completion of the stage 1, tests we have demonstrated the basic feasibility of the concept.
3.2 Stage 2: Provide Sufficient Operation to Support a Decision to Deploy
In addition to demonstrating additional components, for example, a bifurcated switch and alternate
unload options, we propose that approximately 300 hours of operations be carried out during this
stage. The overall objective for this stage is to provide the information necessary to support a
decision to deploy the electromagnetic technology in a commercial operation.
Three hundred hours of operation would provide approximately 30,000 cycles and a travel distance
of 5000 miles. This should be adequate to project failure rates for all components and to provide
information for design improvements that might extend those lifetimes.
Accumulation of 300 hours of operation over a one year period requires an average of 40 hours of
operation a month for eight months.
3.3 Stage 3: Confirmation of Commercial Components Designs
After a decision is made to deploy a commercial system, additional testing would be undertaken to
confirm design details. By way of example, the 30,000 cycles accumulated in stage 2 still
represents a small fraction (0.01 %) of the cycles that a given pipeline joint would experience over a
20 year life, assuming passage of a vehicle every 6 seconds.
Unlike replaceable components (wheels, for example) the pipe joints would be expected to be
lifetime components. It would therefore be prudent to carryout true life tests on joints. A test stand
where fully loaded wheels were cycled back and forth over a test joint would be one cost effective
approach.
Pipe surface wear and in situ re-coating strategies would represent another area amenable to a test
stand approach. During this period various components in the Lakeland mine installation would also
be upgraded and additional operation of the system carried out.
4.0 Assessment of Test Results
The tests which have been done to date establish the basic feasibility of the design. They have also
resulted in several iterations of the design, primarily to improve the robustness of the motor control
system against system electrical noise, and to alter the vehicle switching approach.
While no appreciable life testing has been accumulated, it is already possible to anticipate one
design detail that will require improvement, namely the joints between pipe sections, which will
require a special design to avoid fatigue failure of the pipe ends. The fiberglass pipes used in the
present demonstration were centrifugal cast against an OD mold, resulting in a close tolerance on
the OD, but a significant variation in ID dimension. The wheels tend to shock load the dimensional
steps at the joints resulting in early fatigue cracking. Use of pipes built from an ID mandrel would
greatly reduce the dimensional variation, but we believe that more basic design change will
eventually be necessary to meet the long life fatigue strength requirements. One possible solution
would be to use metallic elements in the pipe-to-pipe joints by molding metal end rings into each
pipe.
There has been little evidence of wheel or pipe surface wear to date. The wheel materials have been
chosen to be soft relative to the pipe surface to assure that the wheels, which are replaceable, will
wear rather than the pipe surface. We can anticipate, however, that it will be necessary to develop a
technique for in situ re-coating of the pipe surface.
5.0 Economic Studies
Economic studies have been made using a costing model with detailed results reported in
November, 2000 [8]. The model takes engineering and unit cost inputs and projects capital and
operating costs for any prospective system. Major capital cost components include pipeline,
vehicles, magnet assemblies, windings and load/unload stations.
The elements of operating cost include power, material costs for maintenance (taken as a fixed
percentage of capital cost) and labor costs for operating and maintaining the system. The model
minimizes total system cost, which we define as the sum of the annualized capital cost plus the
operating cost.
Calculation of the annualized capital cost requires a choice of a minimum attractive rate of return
and a time over which the return will be realized. In past generic studies we have generally fixed
these at 20% and 20 years as illustrative. When we compare our results against specific
competitive targets, we have instead used a rate of return calculation.
Table 3.0 summarizes two typical cases of interest in the phosphate industry. A short haul, low
tonnage case representative of the flow of rock between two processing plants, and a longer haul,
higher tonnage case is typical of finished material flow from the plant to the shipping port. In both
cases, the annual cost of operation, including capital recovery, are compared against existing
transportation costs. Both cases show an acceptable after tax rate of return, 28.9% for the short
haul, and 44.4% for the long haul. The higher rate of return for the long haul is typical of results from
the model. Short haul cases, dominated by the cost of loading and unloading the capsules, have
more difficulty competing with conventional transportation infrastructure.
If the long haul case is compared against a typical long term rail contract, estimated to be as low
as $0.05 per ton-mile, the after tax rate of return would be reduced from 44.4% to 15.7 % and the
payback period increased to 4.5 years.
| Case 1 | Case 2 | |
|---|---|---|
| Distance (miles) | 3 | 30 |
| Tonnage (Mtons/yr) | 2 | 10 |
| Capital Cost | $M | $M |
| right of way | 0 | 2.7 |
| pipeline | 1.12 | 13.2 |
| vehicles | 0.4 | 15.6 |
| magnet assemblies | 0.2 | 7.8 |
| motor windings | 0.21 | 2.3 |
| load/unload stations | 2.03 | 2.8 |
| power units & control | 0.7 | 5.8 |
| subtotal | 4.66 | 50.1 |
| Case 1 | Case 2 | |
|---|---|---|
| Annual Operating Cost | $M | $M |
| insurance & property tax | 0.07 | 0.8 |
| power | 0.04 | 1.1 |
| maintenance | 0.19 | 1.8 |
| labor | 0.49 | 1.5 |
| subtotal | 0.79 | 5.2 |
| Case 1 | Case 2 | |
|---|---|---|
| ($/ton-mile) | $/ton-mile | |
| Operating Cost | 0.13 | 0.017 |
| Competitive Target ** ($/ton-mile) | 0.35* | 0.08** |
| $M | $M | |
| Annual Operating Cost | 0.79 | 5.2 |
| Competitive Target ** | 2.10 | 24.0 |
| Savings available | 1.31 | 18.8 |
| PreTax Rate of Return | 36.8% | 59.1% |
| AfterTax Rate of Return | 28.9% | 44.4% |
| Payback period | 3.0 years | 2.1 years |
* short haul truck transport
** long haul truck transport
A typical quarry-to-plant limestone conveyor transport system of current interest to the Essroc
Cement Group is 2.7 km in length, and has a capacity of 730 metric tons per hour. We have used
our economic model to examine the pipeline scale and vehicle velocity that would minimize the
combined annual operating cost plus annualized capital cost for an electromagnetic drive pipeline of
the same length and capacity.
Figure 9 plots that combined cost per ton-mile as a function of pipe diameter and vehicle velocity.
The curves all show a minimum. They rise at small diameters due to the increasing cost of loading
and unloading and the increasing number of vehicles, and rise at larger diameters as the pipeline
cost increase and the linefill utilization drops. The highest velocity examined, 60 MPH (26.8 m/s) is
clearly the most expensive, driven by the rapidly increasing power system requirement. There is not
a strong difference between the 15 to 40 MPH (6.7 – 17.9 m/s) curves, but the true minimum is for a
26 inch (660 mm) diameter pipe with 20 MPH (9 m/s) vehicles. All the curves show the ripple effect
of integral increments in the number of parallel loading stations used in the model.
The minimum combined cost is $0.267 per ton-mile. If the installation had been twice as long with
the same capacity, the optimum pipeline size would remain the same, but the optimum speed
would be 30 MPH (13.4 m/s). The minimum combined cost would have been $0.206 per ton mile.
Table 4.0 gives the optimum system parameters, and table 5.0, the capital and annual operating
costs for the optimum 26 inch (660 mm) pipe and for a non-optimum 24 inch pipe (610 mm), which
is the scale of the prototype. Figure 10 gives a histogram of the relative component capital costs for
the optimum system.
| Variable | Value |
|---|---|
| Number of vehicles (two way) | 286 |
| Vehicle cluster size | 3 |
| Cluster launch interval (s) | 6.63 |
| Average power requirement (kw) | 132 |
| Payload per vehicle (lb) | 1381 |
| Time utilization | 0.8 |
| Line fill factor | 10% |
| Number of parallel loading stations | 2 |
| 26″ Pipe, 20 mph | 24″ Pipe, 30 mph | |||
|---|---|---|---|---|
| Capital cost | Cost ($M) | % | Cost ($M) | % |
| vehicles | 0.64 | 17% | 0.86 | 22% |
| magnet assemblies | 0.24 | 6% | 0.31 | 8% |
| motor winding assem. | 0.12 | 3% | 0.13 | 3% |
| rescue winding system | 0.00 | 0% | 0.00 | 0% |
| back iron (optional) | 0.08 | 2% | 0.08 | 2% |
| power units (outgoing) | 0.13 | 3% | 0.11 | 3% |
| power units (return) | 0.07 | 2% | 0.05 | 1% |
| block control units | 0.02 | 0% | 0.02 | 0% |
| central control | 0.50 | 13% | 0.50 | 13% |
| pipeline | 0.99 | 25% | 1.16 | 30% |
| load/unload stations | 1.28 | 33% | 0.66 | 17% |
| Total | 4.06 | 3.89 | ||
| ($M/y) | ($M/y) | |||
| Annualized capital cost at 20%, 20 y | 0.83 | 0.80 | ||
| Operating cost | ||||
| Power | 0.18 | 0.14 | ||
| Maintenance | 0.12 | 0.12 | ||
| Labor | 0.50 | 0.50 | ||
| Total | 0.80 | 0.76 | ||
FIGURE 10: Line Length = 2.7 km (1.72 mi.) – Component Cost Histogram at the Optimum Operating Point of 26″ Pipeline, 20 mph (not cached, uses figures in Table 5.0)
6.0 Conclusions
Economic studies have shown that a 60 cm pipe diameter is near the optimum scale for
applications in the phosphate industry. Tests carried out to date on the 275 meter long, 60 cm
diameter pipeline have demonstrated the basic feasibility of the design. The combined results
demonstrate that electromagnetic capsule pumps have the potential to significantly reduce the
throughput limitations of blower driven capsule pipelines. Economic studies of applications in the
phosphate industry indicate that the electromagnetic capsule pipeline systems can be competitive
with truck and rail transport and with slurry pipelines.
While the initial tests have demonstrated the basic feasibility, a follow-on project will be required
before the technology can be commercially available. One goal of such a project will be to
demonstrate that the components can meet the lifetime requirements. A suitable follow-on project
could be to replace truck traffic between two near-by processing plants, or to carry matrix from one
of the mine drag lines to a processing plant.
Acknowledgment
The phosphate project acknowledges the generous support of the Florida Institute of Phosphate
Research, and the IMC-Global Company. We also acknowledge the helpful information supplied by
Jean Paul Morel of the ESSROC Cement Group.
References
[1] Magplane Technology, Inc.,
380 Hanscom Drive, Bedford, MA 01730,
Phone 617 253 5553; fax 617 253 0807; e-mail dbm@alum.mit.edu
[2] Work support by the Florida Institute of Phosphate Research, Bartow, Florida
[3] “A Capsule Pipeline System for Limestone Transportation”, S. Kosugi et al, 7th International
Symposium on Freight Pipelines, July, 1992
[4] “Improving Economics of Existing Pneumatic Capsule Pipeline System for Transporting General
Cargoes”, Henry Liu, 2nd International Symposium on Underground Freight Transportation, Delft,
The Netherlands, September, 2000.
[5] William Vandersteel, US Patent # 4,458,602, July 10, 1984
[6] “Electromagnetic Pipeline Transport System for the Phosphate Industry;” Bruce Montgomery, et
al, 1st International Symposium on Underground Freight Transportation, Columbia, Missouri,
September, 1999.
[7] “Electromagnetic Pipeline Demonstration Project”, Bruce Montgomery et al, 2nd International
Symposium on Underground Freight Transportation, Delft, The Netherlands, September, 2000.
[8] Electromagnetic Transport Systems for the Phosphate Industry, Contract #97-01-144S, Final
Report, submitted November, 2000.
